18 April 2022 | Media
The Cost of Goods in Digital Media
By Adam Ryan
“Accounting is the language of business, and you have to be as comfortable with that as you are with your own native language to really evaluate businesses.”
Warren Buffett
Media businesses are, in general, simple businesses.
People create content. Content creates attention. Attention creates opportunities to monetize. But this simplicity is a masquerade for a complicated industry that brings operators great challenges on a daily basis.
One of those challenges? Understanding how to improve profit margins.
Gross margins and inconsistent reporting
Gross Profit = Total Revenue – Cost of Goods
Gross Margin = Gross Profit / Total Revenue
Gross Margins are leading indicators for investors, whether public or private, if a company can reach a net profit. It’s essentially the starting point to see how a company is operating. If you have bad gross margins, the company is ngmi.
Cost of Goods (COGs) is the direct costs of producing the goods sold by a company. This amount includes the cost of the materials and labor directly used to create the goods. It typically excludes indirect expenses, such as distribution costs and sales force costs.
For most industries, there are well established guidelines for how to calculate gross margins – both what to include and exclude.
In a SaaS business, for example, the industry standard is 80-90% gross margins or 10-20% cost of goods. COGs include things like hosting/monitoring costs, customer support/account management, license fees of products embedded in the application, cost of subscription (i.e. Stripe tax), website dev/support costs, etc.
In a food/bev CPG company, the standard set is ~30% COGs, which includes things like cost of ingredients, packaging, packing labor, overhead of manufacturing, costs of freight/storage, etc.
But what about media?
What is the direct cost of producing the goods sold by a digital media company?
There are a few easy things to list: website costs, tools/services needed to deliver content or advertising like email service providers, and cost of receiving payment.
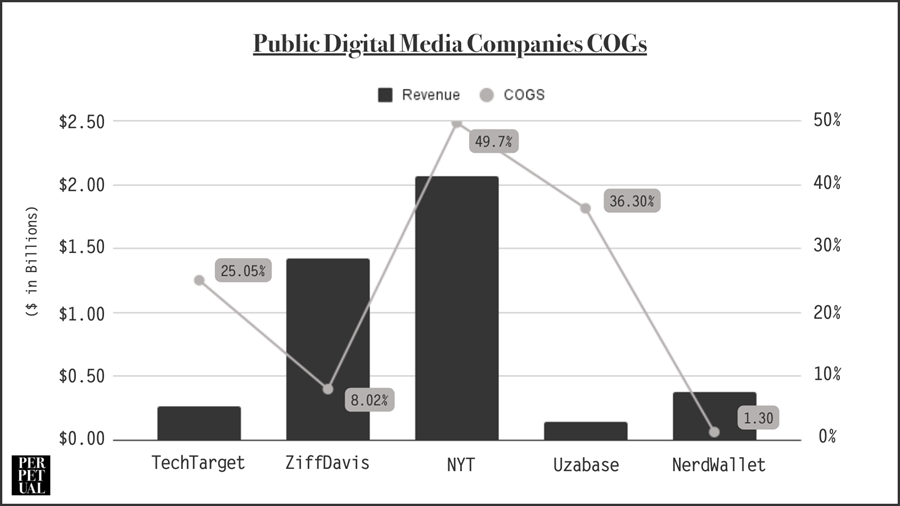
But, in general, most media companies report wildly different numbers for their COGs. There aren’t very many public digital media companies, but here’s a breakdown of gross margins provided by 5 of them:
- TechTarget = 25.05% COGs on $263M in annual revenue
- ZiffDavis = 8.02% COGs on $1.42B in annual revenue
- NYT = 49.7% COGs on $2.07B in annual revenue
- Uzabase = 36.3% COGs on $141M in annual revenue
- NerdWallet = 1.3% COGs on $379.6M in annual revenue
For comparison, here are 5 food/beverage companies:
- Hershey = 52.6% COGs on $8.97B in annual revenue
- Kraft Heinz = 63.5% COGs on $26.04B in annual revenue
- Kellogg = 65.02% COGs on $14.18B in annual revenue
- Hostess (Twinkies) = 62% COGs on $1.14B in annual revenue
- Amplify Snack Brands (SkinnyPop) = 58.4% COGs on $88M in annual revenue
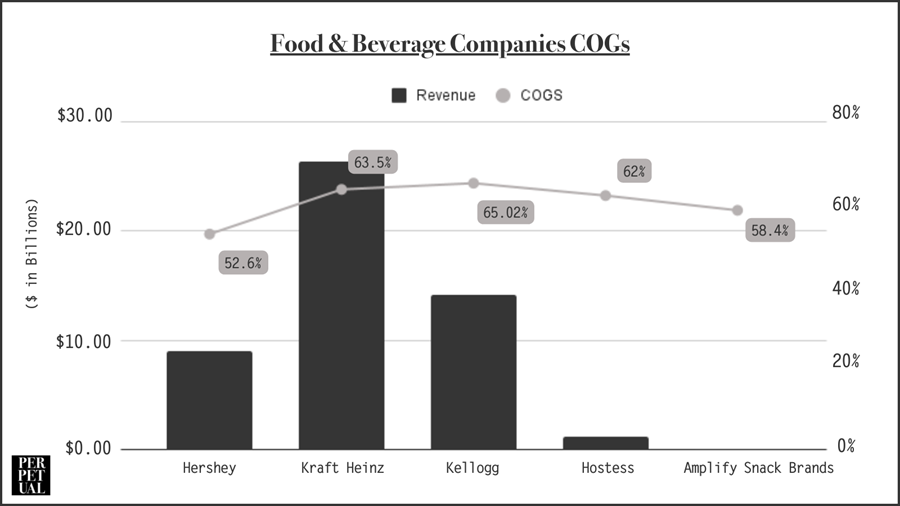
The standard deviation of COGs in that sample set of media companies is 19.89 vs 4.95 for COGs of the food/beverage industry.
Is this a perfect sample? No. But when comparing the topline revenue of those media vs CPG companies, the standard deviation is actually 30% less for the media companies – meaning, the set of media companies are more similar in size.
Could it be that media companies struggle to find profitability and scale because the industry, as a whole, is not understanding what leading indicators (gross margins) to improve on to ensure lagging indicators (profit)?
If so, let’s get on the same page…
Cost of Content
Content, for most media businesses, is how they make money. The goal of investment in the content team is almost exclusively to drive more revenue.
There are 2 components of content costs: (1) talent & (2) production.
Talent Costs
Some companies, like Buzzfeed, have relied on a “quantity over quality” approach when hiring in an effort to increase their topline revenue. Why? More writers equals more stories, more stories equals more pageviews, more pageviews equals more money.
Alternatively, there are companies like Morning Brew who still only have 4 people write their daily newsletter that goes out to more than 4M+ people every day.
Other companies, like Barstool, take a bit more of a “power law” approach to their talent. They sign a bunch of talent for average or below-average pay. Then, if they see a particular talent exploding and attracting more eyeballs, they’ll give that talent more budget to do more unique projects – thus, create more sponsorship revenue.
An example of this was in 2020 when Barstool went all in on the “Zillion Beers” campaign when Dana Bahrawy started to gain major traction on social. The talent that end up exploding get one-off bonuses, putting their pay well above industry average.
Production Costs
The other component of content costs is the cost of production. For some companies, like NerdWallet, the costs to produce content are very low – they don’t rely heavily on video, audio, or even custom images. Compare this to businesses like Vox or the NYT who sometimes invest tens of thousands into one single piece of editorial content.
Same thing applies when it comes to integrated marketing teams or content studios – the production cost is the COG, but is often moved into the category of operational expenses.
The Takeaway
The Cost of Content matters. Is it linear like Buzzfeed’s model? Does it take a lot of capital like Vox?
Having more consistent language around the cost of content allows us to more easily identify the companies in the industry with the best business models – and ways to improve.
TL;DR The Cost of Content is a subcategory of COG and it should include all content production costs – from design to video production, all compensation for contributors who create content both sponsored and editorial, and any editorial role that isn’t primarily in management.
Cost of Sales
The Cost of Sales varies primarily for businesses driven by advertising or sponsored content.
The purpose of determining the Cost of Sales is to identify how much human capital it takes to manage and scale the revenue of the business. This cost includes all individual contributors with quotas, account managers, and sales managers.
Unlike most industries, the media industry has a wide range in how much sales departments are paid – some operators I’ve spoken to say they pay close to 25% for the sales operations to their sales team per $ brought in, while others pay closer to 8%.
In reality, the cost of sales is highly influenced by the success of the brand:
- If your company has a large amount of inbound demand from advertisers and your renewal rates are strong, then you’ll pay less for sales. This is why having a great brand and content pays.
- Companies earlier in their journey, or those who struggle to scale, will need to pay more for sales because it takes more people and more work to achieve higher numbers.
The Takeaway
Having more consistent measurements for a Cost of Sales shows how a company is doing with their advertisers and their brand.
TL;DR The Cost of Sales needs to be a subcategory of COGS and should include all quota carrying sales reps, account managers, and sales managers.
Cost of Audience
In almost all income statements, there’s a line item for marketing. This is obviously a helpful metric to gauge.
For some companies, like Red Bull, you see a big number that drives a huge portion of sales. In other businesses, like Tesla, you see nothing. It does tell a story.
But there is a difference with media businesses and marketing –
Cost of Talent vs. Cost of Audience
Media companies can build an audiences (like email subscribers) from paid advertising – these subscribers may come from referral programs or just blowin’ cash on Facebook.
In the worst case scenario, media businesses can be totally reliant on marketing to maintain an audience (think Ozy).
But don’t jump to the conclusion that the cost to develop and maintain an audience is inherently bad. Let’s use Barstool and Morning Brew as an example:
- Barstool uses their talent to grow their audience, then pays bonuses to the biggest talent for their impact on audience growth. Their Cost of Talent will be higher, but their Cost of Audience will be lower.
- Alternatively, Morning Brew, who has historically relied on paid ads for the majority of their growth, may have a higher Cost of Audience with a lower Cost of Talent.
The Takeaway
Some media companies may invest more in marketing than in talent and vice versa – and the way they invest in marketing gives a clear vision of what the business is investing in to grow, as well as their path to profitability.
TL;DR The Cost of Audience should include the financial investments made directly to grow and maintain the audience. This should include any growth marketers, paid advertising spent to grow the audience, and any costs to create those ads (like the costs of copywriters and graphic designers).
The COG of Modern Media
Media is an incredibly difficult business to scale to profitability. Out of the 8 publicly traded digital media businesses I looked at, only 2 were profitable last quarter.
Is digital media just a shitty business? No.
Is digital media still a new industry in the scope of accounting, meaning the traditional metrics don’t totally align? Yes.
So it’s time to create a new standard.
From my estimates, a modern digital business using the formulas laid out above should aim between 60%-70% COGs. At these ranges, the company should be set up to have a net profit of 15-25%.
We need to do this not to appeal to investors or make our accounting teams feel important, but to have the right information to improve the only lagging indicator that matters: profit.