03 February 2022 | Venture Capital
2/3/2022: Chart of the Day
By
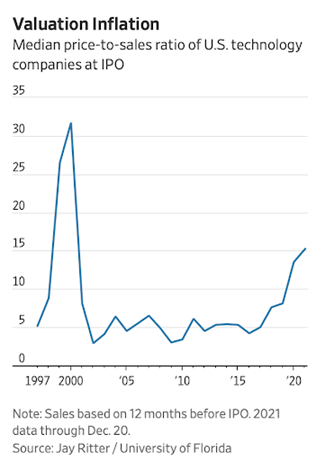
This chart is from a must-read piece in the WSJ about the valuation cuts hitting the startup industry.
Main takeaway? The 2021 P/S ratio for US tech companies that IPOd was 15.2 vs. 8.1 in 2019 – nearly doubling in 2 years.
And this increase didn’t only affect companies that went public — it hit startups, too. US startups valuation hit $4.5T in 2021, also nearly doubling from 2019.
Also- really interesting to note that in 1999 (dotcom bubble), the P/S was 2x that of 2021. Question for all the Gen Xers: Did y’all know how crazy things were while they were happening?
I just wish I wasn’t two in ‘99 and could have experienced the craziness for myself – and I wish Twitter was around too to hear everyone’s thoughts.